
Client Work: Visualizing Big Data
Did you know that more data has been produced in the past 2 years than in the entire rest of the history of mankind? It boggles the mind!
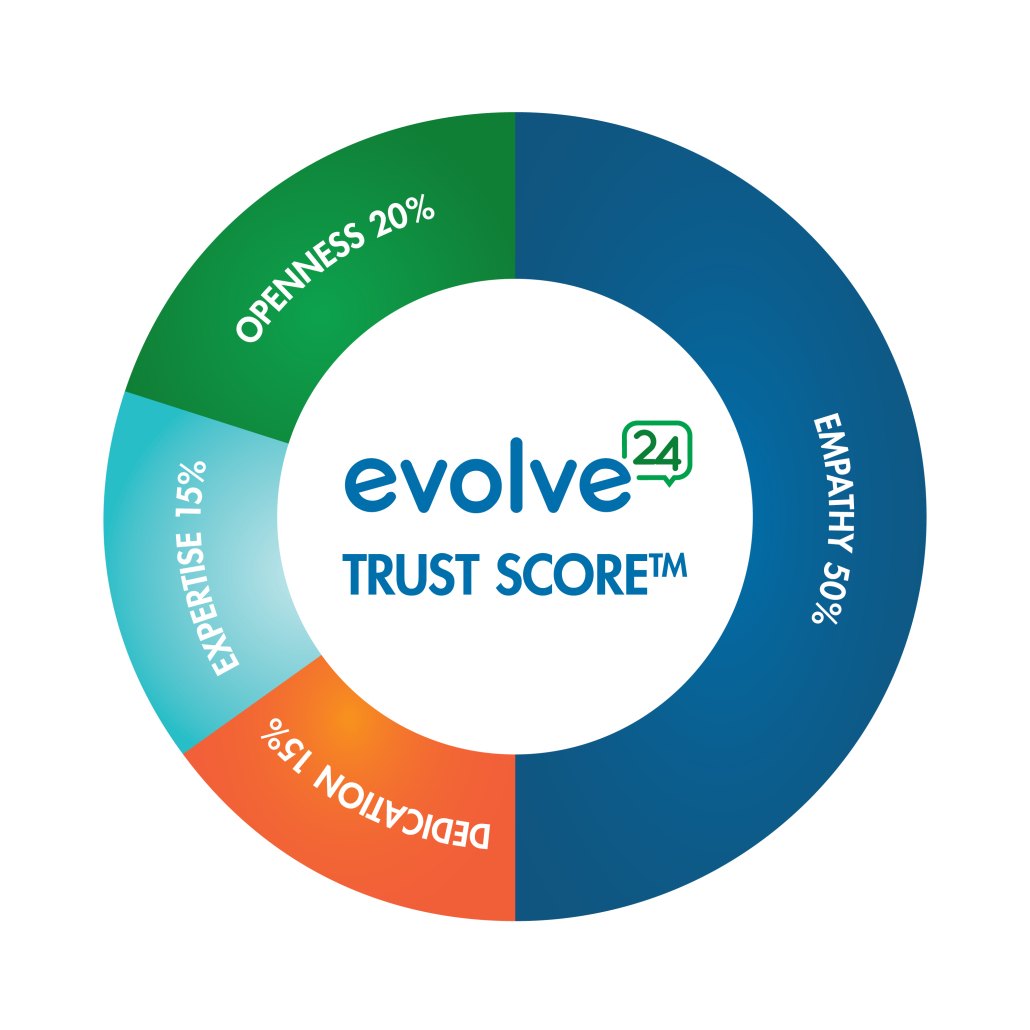
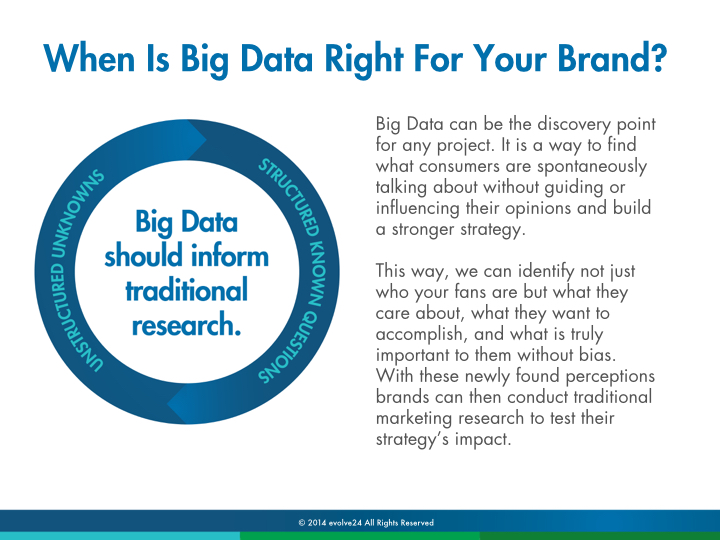
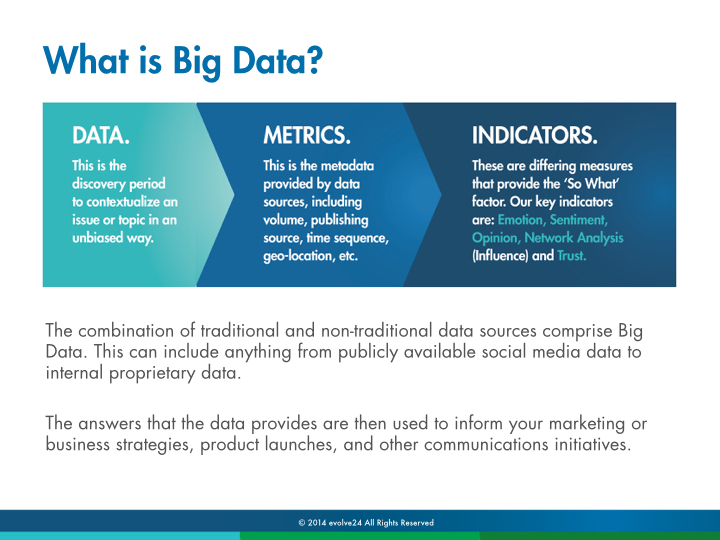
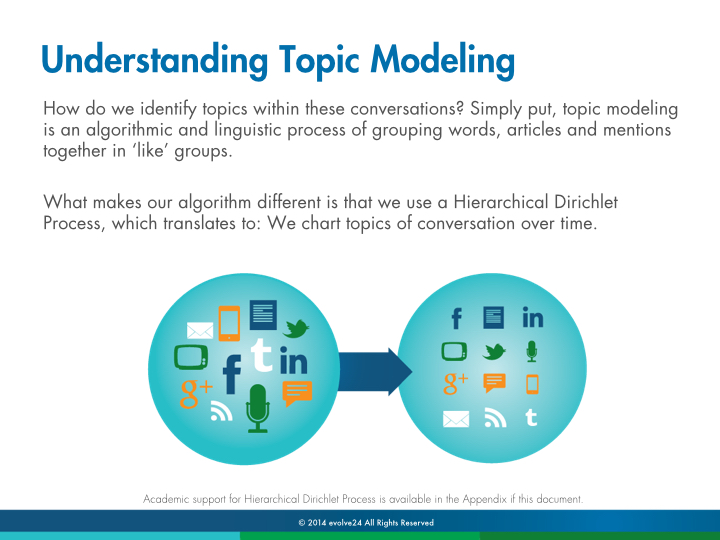
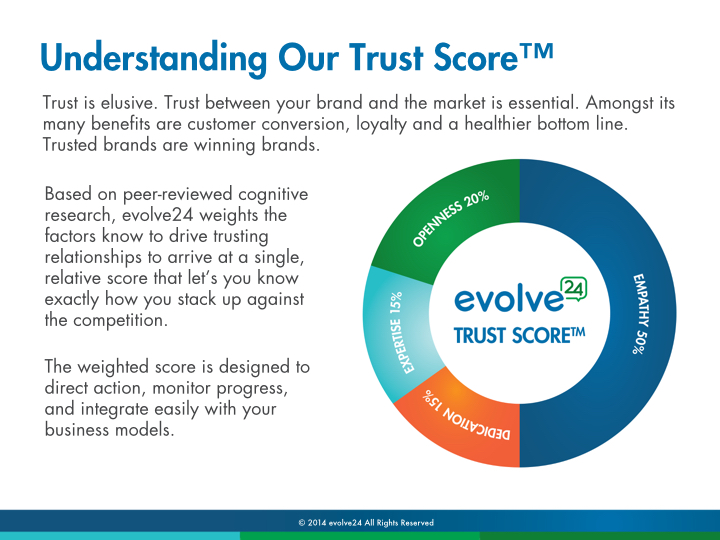
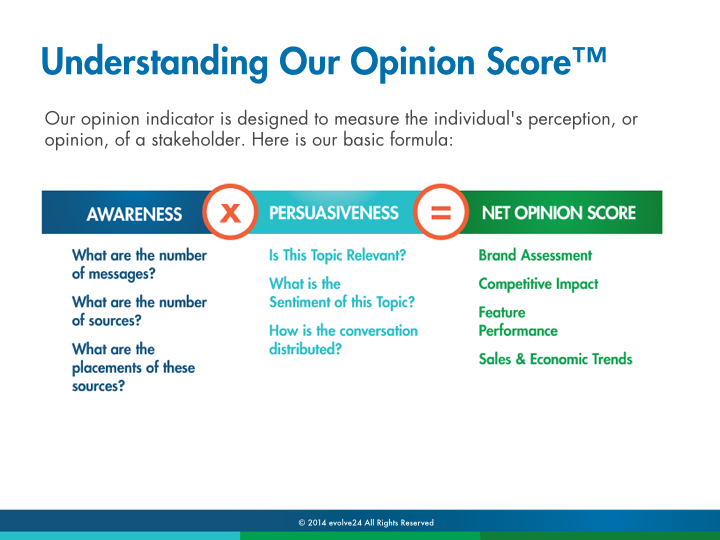
One client I work with regularly, evolve24, works to help companies make sense of the big media madness. Since their business is data, and incredibly complex data, they often find it challenging to find the right visuals to use on their website, in their client presentations, etc. One project I did with them toward the end of 2014 was a presentation deck focusing on their methodologies. In addition to the graphics, I also created templates for all company powerpoint presentations, including cover slide, section break slide, and a few variations of content slides. Here are a few of the slides and the graphics I created for them.
I really enjoyed working on this project with them! I really enjoy the creative challenge of trying to figure out how to create a visual interpretation of a complex topic. Maybe since I am a visual learner myself, I know the importance and impact of having graphics to help someone understand something. You can be offering clients the most amazing product in the world, but if they can’t understand what you’re offering, you’ll be way less likely to make those sales.
If any other businesses out there want some help creating impactful graphics to help promote their business this year, I’d love to help. Shoot me an email at anna@annakeith.com and let’s talk about how I can help you.


We love working with you, Anna. You have a way of taking my ‘garbly-gook’ vision and making it a reality; that’s a unique skill and one we’ve come to appreciate in our time working with you. can’t wait to get going on our next series of projects!
Thanks Heather! Looking forward to working with you guys again soon. 🙂